Waste tracking, without the spreadsheets.

Without paper forms.

With Mapistry, stay compliant with fewer resources than ever.

gp-home
Republic Services Logo
Lehigh Hanson Logo
white-gmr-home-1
mv-transit-home-1
Constellation Brands Logo PNG
Data flow-1

Collect waste data automatically and in real-time

Automatically collect waste data from your existing systems or add waste manifest data from your waste haulers with Mapistry's AI-assisted file upload.

This dramatically cuts the resources needed for data entry and prevents costly data entry errors. Learn more about data collection.

Monthly waste table with green check mark indicating

Know your generator status and keep fees down

Incorrect spreadsheet calculations are a liability in your waste tracking.

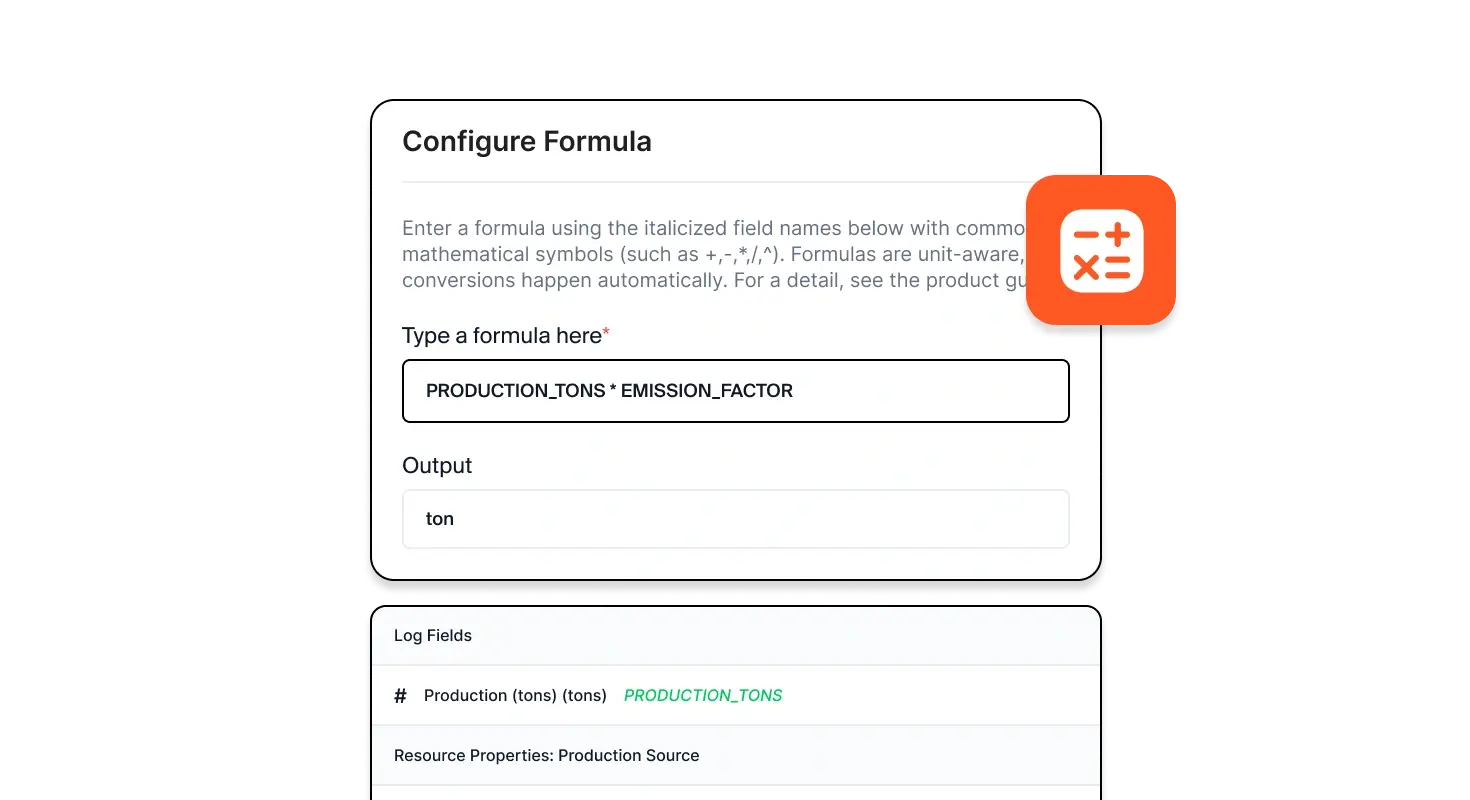
With Mapistry, you can set up your calculations to know how you are doing against your generator status or which locations are generating more hazardous waste than others. Learn more about calculations.


Screenshot of a Monthly Hazardous Waste log with some rows highlighted in red because their SQG Status has been exceeded.

Stay ahead of your waste targets with real-time data

When you don't update your spreadsheets until the end of the month or year, you're going to miss opportunities to modify your generator status and stay under limits.

With Mapistry, you can capture your data in real-time, automatically run calculations, and notice when you're approaching limits. Learn more about analytics.

Screenshot showing a table listing waste sources with columns Name, Waste Description, Waste Type, Matrix and Feed1.

Manage waste streams from a central location

Centrally manage your assets, including federal and state waste codes, matrix, density, TRI chemicals, and even company specific categories - and reference them in your calculations and reports.

Whenever an asset needs to be updated, you can change it from one central location rather than combing through all your spreadsheets references. This keeps your data accurate and reduces the risk of accidental exceedances.

The one platform to replace your environmental chaos

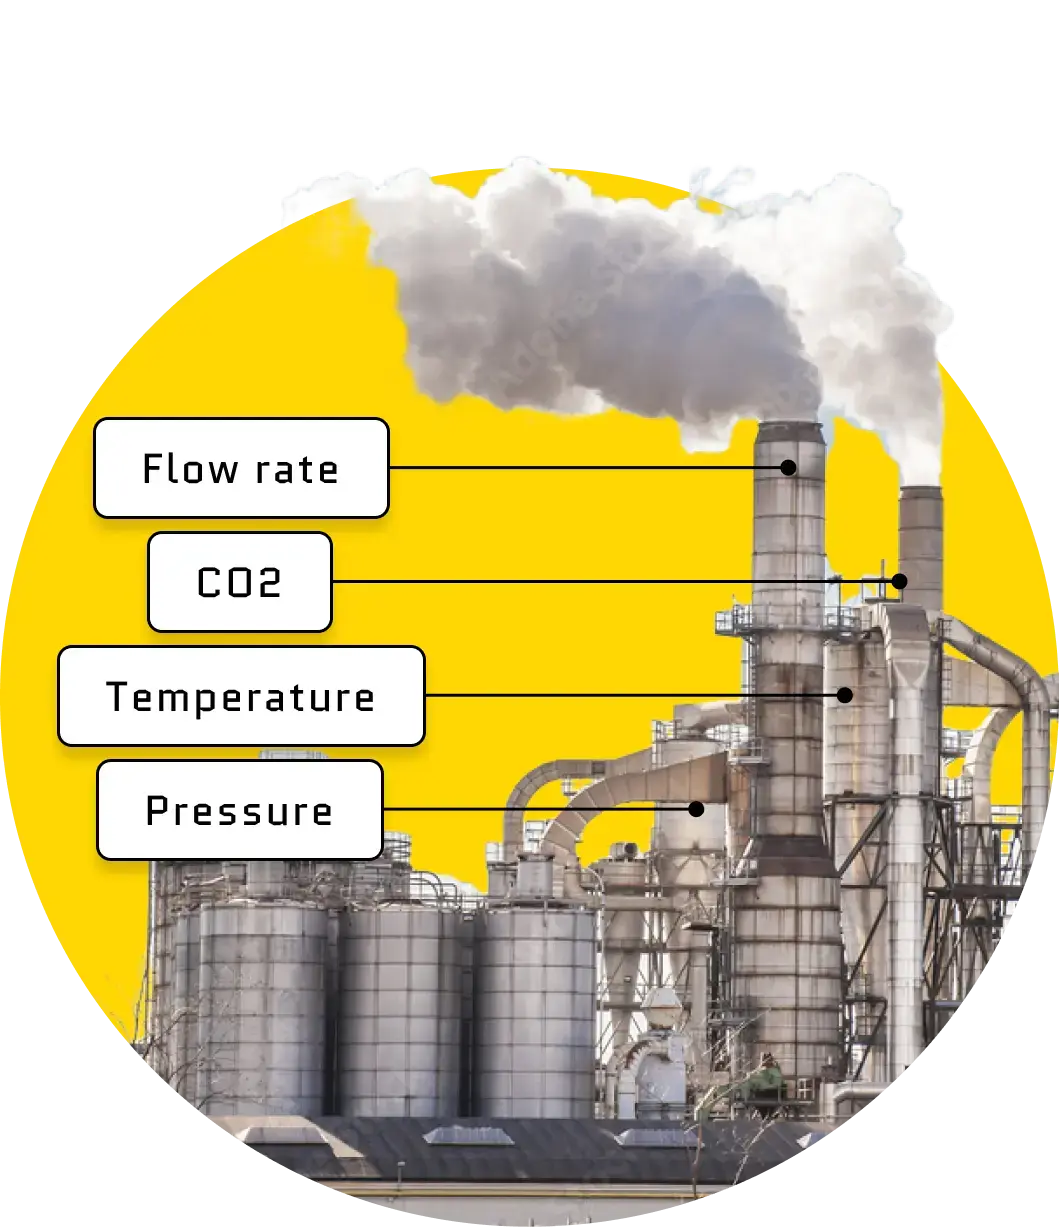
Collect numerical data and monitor limits. Without the spreadsheets.

Data flow

Keep track of deadlines and tasks. Without playing email tag.

Email reminders

Keep a pulse on your sites. Without the windshield time.

Enviromental overview

Complete inspections and track corrective actions. Without paper forms.

Spills or Leaks

Why EHS software has let you down, and how we’re different

Star 1
Star 1
Star 1
Star 1
Star 1

Rated 4.9 stars based on 36 reviews

Better compliance. Less chaos.

See how Mapistry works in a short call. This is what we’ll cover:

Icon

Your team’s compliance needs

Icon

A personalized tour of Mapistry

Icon

Detailed pricing based on your needs and number of locations

Book a demo