.svg)

.svg)

.svg)
.svg)
.svg)
%201%20(2).png)

.svg)
.svg)


.svg)
.svg)
Iron is ubiquitous on industrial sites, from steel equipment to dumpsters to metal grates. However, in California, like many states, industrial stormwater permit holders need to analyze their stormwater samples for iron. If your facility exceeds California’s numerical action level (NAL) for iron, you’re not alone!
Currently, 209 facilities have an iron parameter in Level 1 status and 141 facilities have an iron parameter in Level 2 status. That means 11% of facilities sampling for iron are struggling to lower concentrations below the NAL of 1 milligram per liter (mg/L). Fortunately, the correlation between iron and total suspended solids (TSS) concentrations in stormwater samples may solve your biggest stormwater headache. Let’s dig into how they are linked and what to do about it.
Background
Iron (Fe) is the most abundant element on Earth and the fourth most abundant in the Earth’s crust. Iron is so common in the natural environment because it’s formed by nuclear fusion (Stucki et al., 2012). Iron has a type of bonding called metallic bonding. In metallic bonding, the outer shells of adjacent atoms overlap, and the outer shell electrons are free to move through the molecular lattice. The metal consists of metal cations and a balancing number of these ‘free’ electrons. Translation: Iron remains in the natural environment for a very long time.

Let’s not forget that major Fe-bearing minerals in the earth’s crust are highly susceptible to chemical weathering (Bodo, 1989). Weathering processes break down rocks and minerals over time to eventually form soil; thus, soil is abundant in iron.
These eroded soil particles (or solids) can then be carried by stormwater into surface water. In 1999, as part of a series of preliminary studies in the stormwater effluent guidelines program, the Environmental Protection Agency (EPA) emphasized that solids are one of the most common contaminants in urban stormwater. Solids originate from many sources, including erosion of pervious surfaces and dust, litter and other particles deposited on impervious surfaces from human activities …
Solids also provide a medium for accumulating, transporting, and storing other pollutants including metals.” That means solids come from your gravel/dirt lots (pervious surfaces) and accumulate on paved parking lots (impervious surfaces). Therefore, the key to understanding why iron is present in your stormwater samples is likely linked to understanding how TSS enters stormwater runoff.
Sources of TSS
How does TSS end up in your stormwater? Let’s talk about some common sources of TSS at industrial facilities. Many industrial sites are large with hundreds of acres of unpaved property to monitor. Unpaved sites typically have higher TSS concentrations in stormwater due to stormwater runoff capturing the loose iron-containing soil that erodes between storm events (Christensen et al., 1979). Most industrial facilities also have industrial activities contributing to TSS concentrations.
Some of the typical culprits are as follows:
- Heavy truck and forklift traffic;
- Landscaped areas;
- Nearby construction sites;
- Aerial deposition;
- Vehicle tracking (e.g. tires);
- On-site stockpiles;
- Unpaved yard;
- Degraded concrete and pavement;
- Industrial processes, such as metal cutting; and,
- Historical deposits in the stormwater system.
The Link Between TSS and Iron
Now that we know some of the potential sources of high TSS concentrations, we can discuss how solid material present at an industrial facility, such as sand, fines, soils, organic materials, etc., contributes to the concentration of iron in stormwater. As described previously, iron is the most abundant element on Earth and makes up a large part of soil due to its susceptibility to weathering.
Therefore, solids, even in small concentrations, may result in iron concentrations that exceed the permit levels. Figure 1 below displays data downloaded from the California State Water Resources Control Board’s Stormwater Multiple Application Report and Tracking System (SMARTS) website. Data are shown for over 14,000 sampling events between 2010 and 2018 at facilities that sample for both iron and TSS.
The chart shows the trend line demonstrating the linearly correlated relationship between log-transformed TSS concentrations and log-transformed iron concentrations[1]. Looking at the trendline, you can observe that lower TSS concentrations generally have lower iron concentrations and higher TSS concentrations generally have higher iron concentrations.
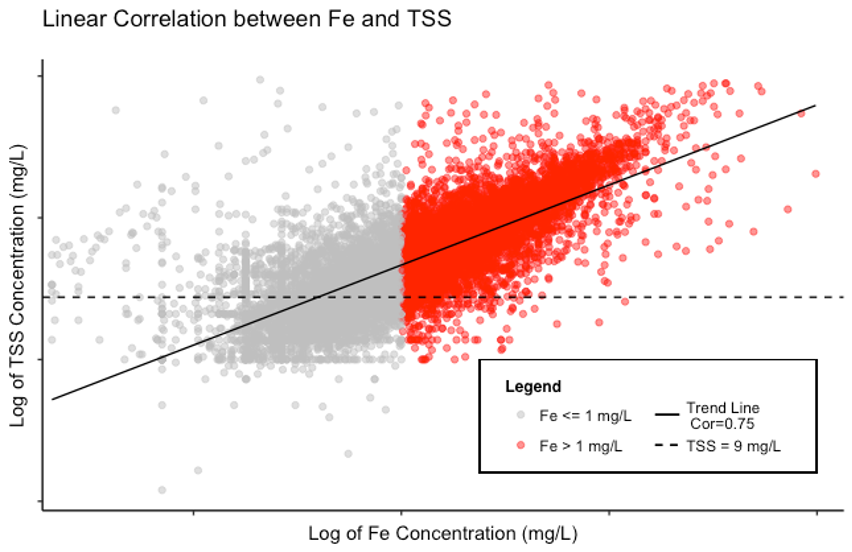
Figure 1. The linear correlation between iron (Fe) and TSS. As represented by the solid black Trend Line, the Pearson correlation coefficient was calculated to be 0.75 (on a scale of -1 to 1) indicating that the pollutants are positively correlated (i.e. low Fe = low TSS and high Fe = high TSS). The points where iron exceeds the NAL of 1 mg/L are shown in red. Notice how most red points are above 95% Lower Confidence Limit of TSS = 9 mg/L (dashed line). Note that both axes are displayed on a lognormal scale.
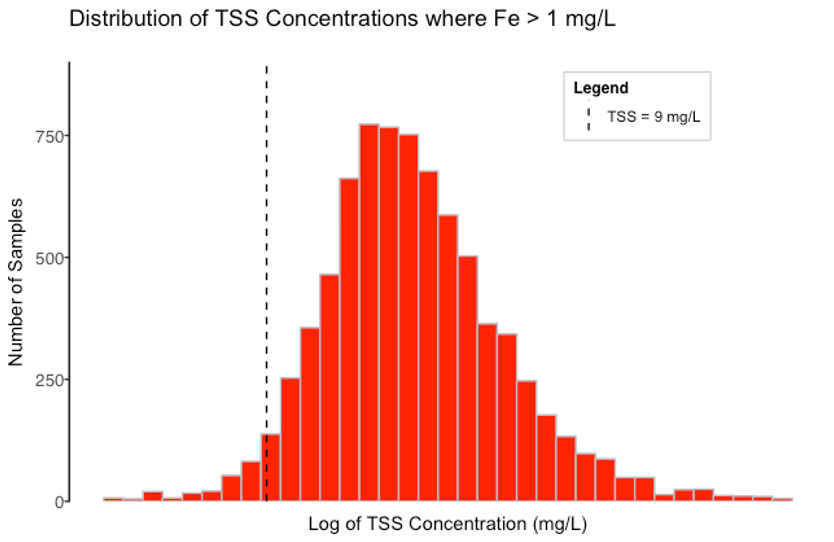
Figure 2 shows the subset of data where the iron concentration is greater than the iron NAL of 1.0 mg/L (the red points in
Figure 1). As marked by a dashed line, the 95% Lower Confidence Limit for those TSS concentrations is 9 mg/L. In other words, most TSS concentrations are above 9 mg/L when the iron concentration is over the NAL. The strong correlation between TSS and iron indicates that if TSS is reduced to less than 9 mg/L, iron will most likely drop below the NAL of 1.0 mg/L.
Iron and TSS at a Landfill
However, Mapistry’s hypothesis is that if the TSS concentration is able to drop to about 10 mg/L, iron would also drop below the NAL. But reducing TSS to 10 mg/L from more than a whopping 2,000 mg/L is no simple feat. Our BMP recommendations to make it happen include:
Filter Solids from Coarse to Fine
Instead of relying on just one BMP, like a single check dam or a single silt fence to reduce your solids, build a series of BMPs to filter pollutants from big to small.
For this particular facility, we recommend adding check dams every 10 feet, allowing the runoff to filter through a series of check dams, before entering a rip-rap apron around the discharge point.
Finally, install a silt fence to filter the stormwater after passing through the rip-rap apron. A concrete berm could also allow stormwater ponding before final filtration via the silt fence. This allows a three-fold approach to filtration, targeting the largest solids first, then gradually filtering to the smallest.
When selecting BMPs and filtration media, always prioritize filtering from coarse to fine to ensure you are creating a system of BMPs. As an enhancement, specialty media or more geotextiles could be used instead of the silt fence to remove solids and iron.
Move a Sampling Location
When choosing a sampling location make sure the location:
-
- Is representative and doesn’t increase solids. We’re talking about sheet flow (i.e. stormwater enemy #1). Sheet flow not only increases solids but also increases the likelihood sampling will not be representative of runoff due to the higher speed of the water. Plus, sample collection is tough from sheet flow or in an area with loose dirt that can be suspended or scraped up in samples.
- Allows for the optimum amount of settling time. Settling time is crucial for TSS and other solids to drop out.
- Is located downstream of BMPs. This may seem like a given, but many facilities sample before BMPs. Some sites make the mistake of collecting samples before the final filtration material or they sample after stormwater has been conveyed through rusty pipes, which could add iron to their stormwater sample.
Housekeeping, housekeeping, housekeeping!
We can’t say it enough: housekeeping works, including:
-
- Training. Ensuring staff understand how and where to samples is crucial. Additionally, understanding when to take samples is vital and don’t forget to avoid the first flush at all costs!
- Sweep often! Make sure to choose a sweeper that works with your site. Some sweepers can only increase TSS by disturbing topsoil and rustling loose solids. Understanding what areas can benefit and cannot be swept is also key. Unpaved sites are usually not good candidates for a street sweeper, but paved sites are great candidates!
- Clean and maintain BMPs. Those lovely check dams retain solids well but need some love and attention to keep them functioning. Clean them out before rain events to prevent clogging and bypass of runoff.
Increase Infiltration
Make the soil that is partially contributing to your iron and TSS work for you instead of against you! Increasing infiltration area not only replenishes the groundwater but it also allows the natural filtration process through soil to take place.
For example, particulate-bound metals are removed as runoff infiltrates through mulch and sandy soil layers. This sometimes can be tough to do if the underlying geology is clay or mud, there’s not enough distance to groundwater, or a facility has well-compacted ground surfaces.
Implement Erosion Control Methods
Permeable surfaces have the potential to erode during heavy rain events. The following BMPs can prevent erosion and sedimentation: preservation of natural vegetation, seeding, mulching and matting, plastic covering, silt fences, temporary/semi-permanent drainage swales, check dams, and sediment traps and ponds.
These control measures installed along slopes can direct stormwater runoff to a sedimentation basin where solids are allowed to settle out of runoff before discharging off-site.
Plant Vegetation with Caution
While vegetation is key to filtering solids out of stormwater, planting vegetation will also disturb soils. Allow plenty of time before the rainy season to plant vegetation so that vegetation is established and able to collect solids rather than erode.
Also, consider that fertilizing vegetation contributes to nitrates in stormwater so probably wise not to use any, if possible, or just enough to promote growth.
Final Thoughts
Iron is a problem for many industrial facilities in California because iron and TSS occur both naturally in the environment and industrial activities and materials.
The correlation of TSS and iron indicates that reducing TSS concentrations to below 9 mg/L also reduces iron concentrations below the NAL of 1 mg/L. While reducing TSS concentrations to 9 mg/L at a large, unpaved facility may seem near impossible, Mapistry customers have had success. Installing inexpensive stormwater BMPs to reduce soil erosion and filter out solids has proven successful.
Works Cited
B.A. Bodo, Heavy metals in water and suspended particulates from an urban basin impacting Lake Ontario, The Science of The Total Environment 87/88 (1989) 329- 344. A. Dong, G. Chesters, G.V. Simsiman, Metal composition of soil, sediments and urban dust and dirt samples from the Menomonee River watershed, Wisconsin, USA, Water, Air and Soil Pollution 22 (1984) 257-275. E.R. Christensen, and V.P. Guinn, Zinc from automobile tires in urban runoff, Journal of the Environmental Engineering Division ASCE 105 (1979) 165-168. Stucki, Joseph W., Bernard A. Goodman, and Udo Schwertmann. Iron in soils and clay minerals. Vol. 217. Springer Science & Business Media, 2012. [1] Log-transformations are used because the data follow a lognormal distribution. The log-transformation is used to convert the data to a normally-distributed dataset to view the linear relationship and calculate the correlation.