.svg)

.svg)

.svg)
.svg)
.svg)
%201%20(2).png)

.svg)
.svg)


.svg)
.svg)
Today, we’re publishing our first piece of research for Mapistry Labs, a series that makes publicly available enforcement data easy to understand for environmental teams.
In this inaugural piece, we’re investigating enforcement data within the Clean Air Act. We’ll dive into basic trends like the number and severity of enforcement actions since 1980.
In future pieces, we’ll analyze subsegments of the data, e.g. to show industry trends or to understand where penalties are hitting especially hard. If you want to receive future reports to your inbox, please sign up below.

You can read more about our methodology at the end of the article. If you want to access all charts from this report, you can download all the images on Google Drive. Feel free to share any of our findings on social media.
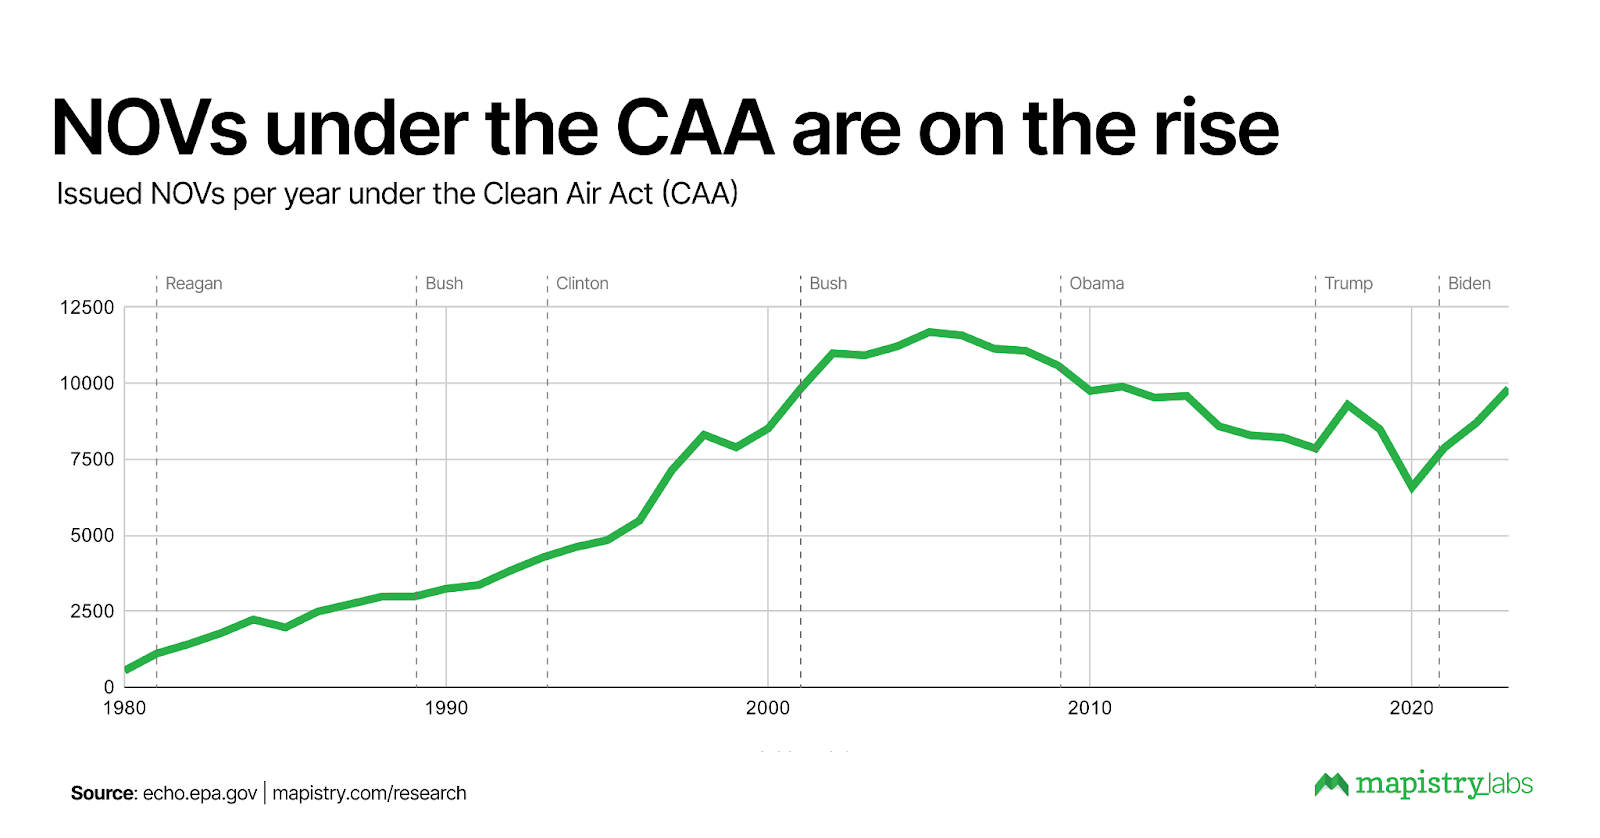
Insight #1: Notices of Violation (NOVs) are on the rise again
Notices of Violation (NOVs) are something like the backbone of environmental trouble you can get yourself into.
If you’re not familiar with NOVs, they are formal notifications issued by environmental regulatory agencies to companies that have breached environmental laws or regulations. NOVs can lead to substantial financial repercussions, including hefty fines, legal fees, and the costs associated with required corrective actions or operational shutdowns. Additionally, NOVs can damage your company's reputation (especially with the rise of public data), potentially leading to lost business, increased scrutiny from regulators, and higher insurance premiums.
In short, you don’t want to get an NOV.
We wanted to know how NOVs for air infringements have developed in the last decades.
Right click to save this image. You can share all Mapistry Labs images on social media.
After over two decades of growth up until 2005, the number of NOVs issued fell to an all-time low in 2020 - likely because the economy came to a screeching halt during COVID.
But since 2020, the number of NOVs has started increasing again, with three consecutive years of growth and a whopping 10,480 NOVs issued in 2023. This is a surprising development considering that formal enforcement actions are trending down, which we’ll discuss next.
Insight #2: Formal enforcements are at a historical low
Formal enforcements (as opposed to NOVs, which are informal enforcements) include administrative orders, civil judicial actions, and actions with and without penalties.
We wanted to know how formal enforcements and, most importantly, penalties have developed. Are they following the same upward trend as NOVs?
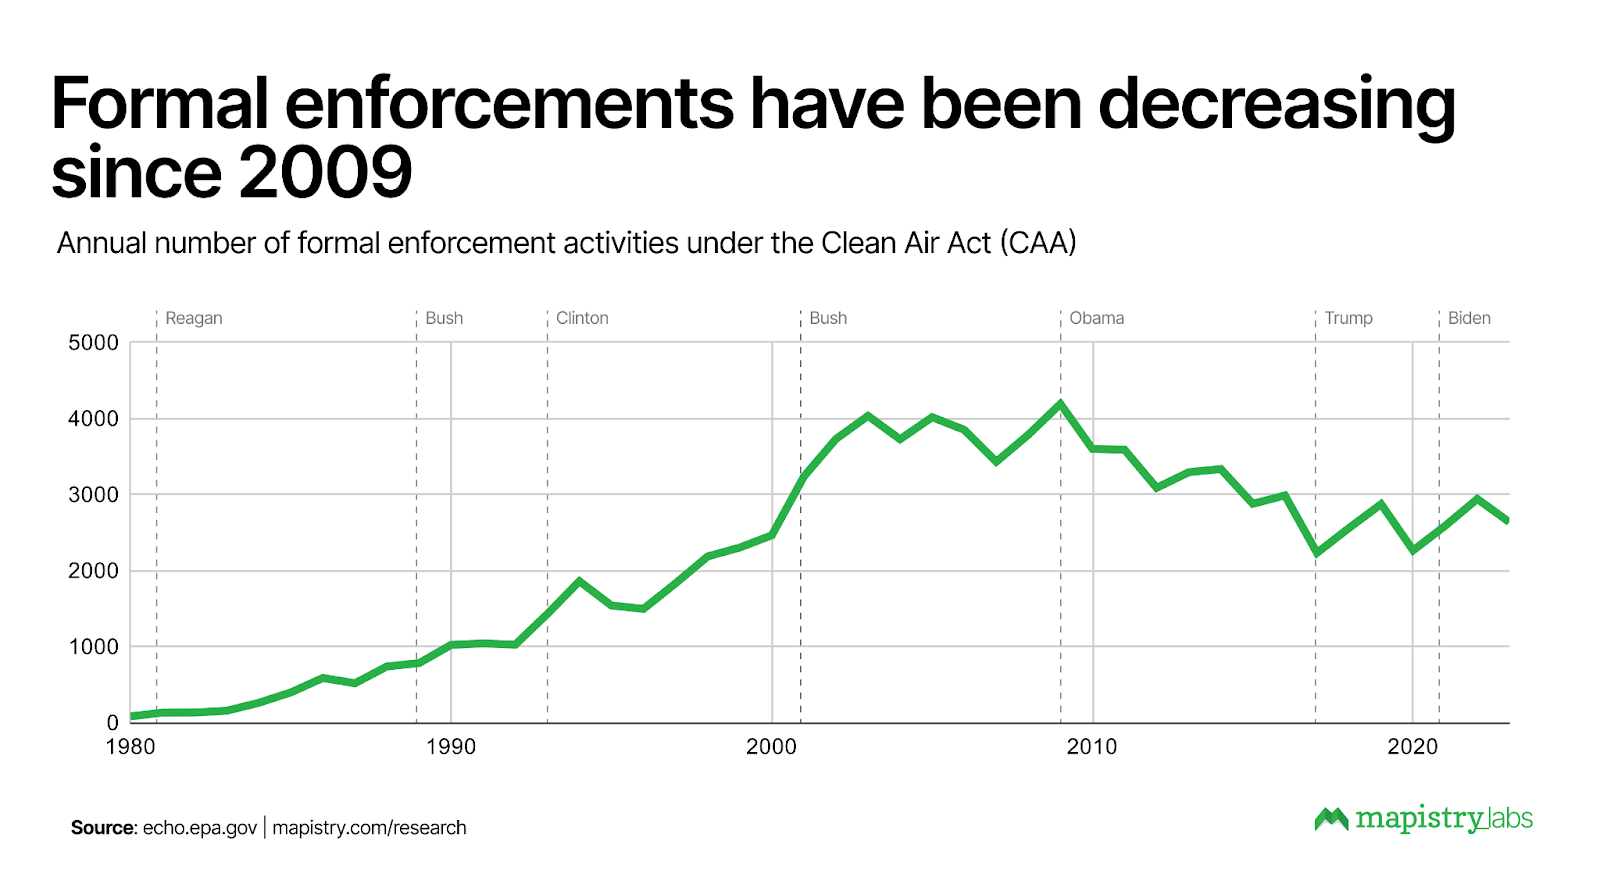
The data provides a mixed answer. While formal enforcements seem to follow the overall direction of NOVs and vice versa, the development since 2020 is very different.
While the number of issued NOVs shot through the roof in the past three years, formal enforcements have been on an intermittent downward trend since 2009 and only increased slightly since 2020.
(As a side note, one of the largest declines for both formal and informal actions was during the Obama administration. Before we begin taking sides, compare that to a steep increase during the Clinton years, also a Democrat.)
Insight #3: Penalties fluctuate wildly and have reached an all-time high in 2023
Finally, let’s start talking about money and penalties; the big bad wolves of environmental compliance.
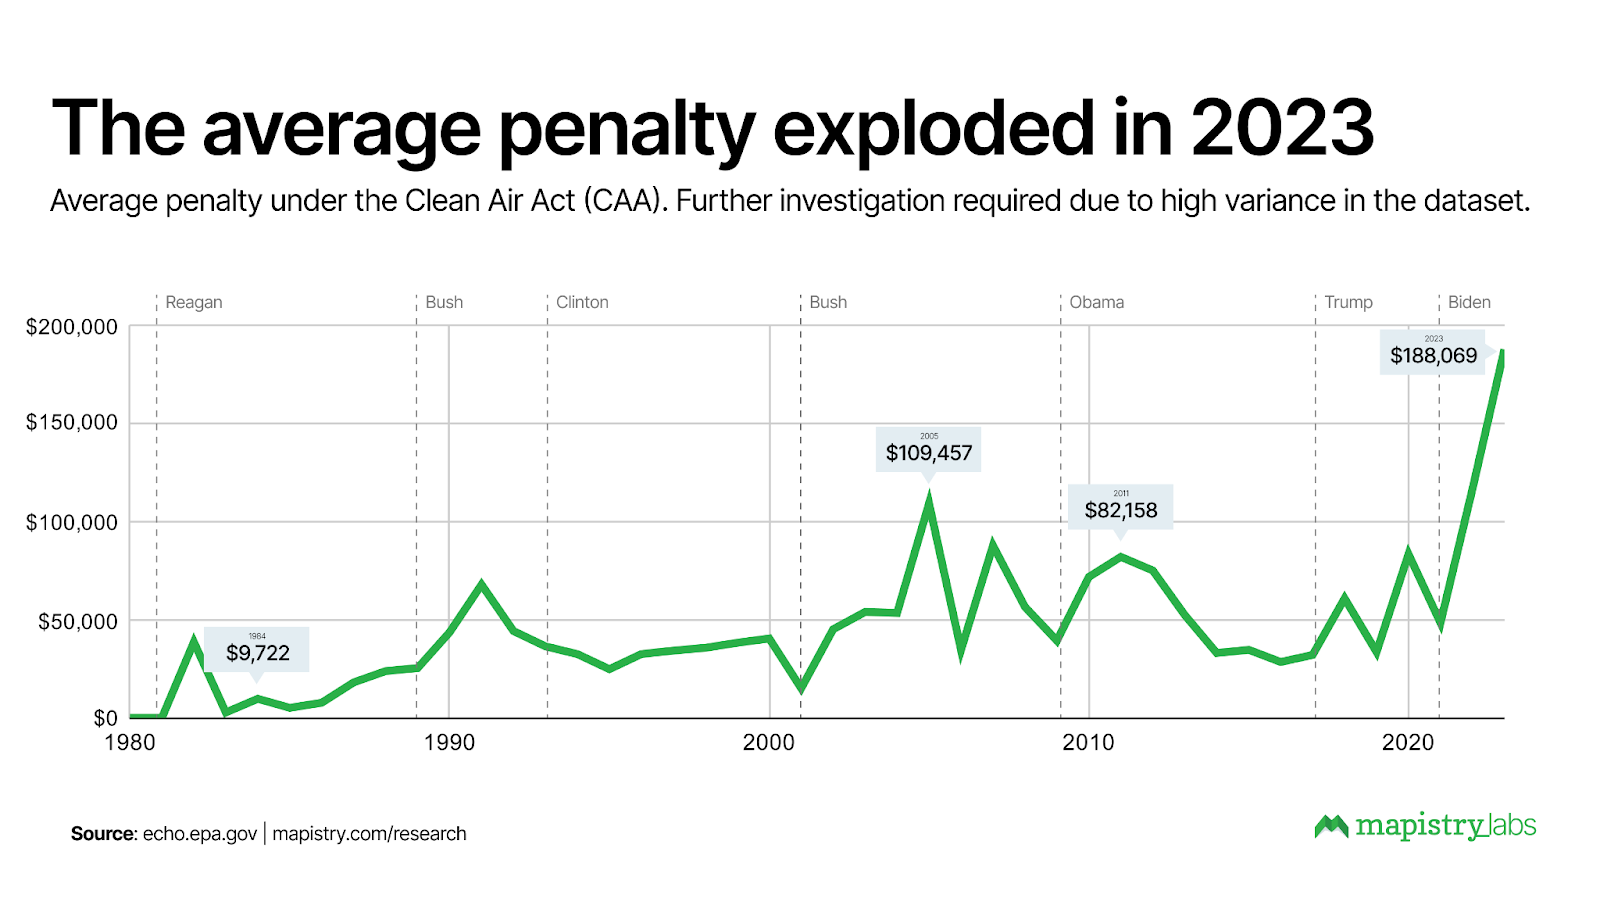
The average penalty in 2023 was $188,000, which is up significantly from previous years, where the average penalty was somewhere between $40,000 to $80,000 (or even just $9,722 in the good ol’ days of 1984). We also reviewed the median penalty amount, which has increased 69% since 2015.
As you can see, the average penalty fluctuates heavily, so we’ll dedicate the next Mapistry Labs edition to CAA penalties and how they’ve developed across industries, pollutants, and industry sizes.
If you’d like to get the next report to your inbox, you can sign up here.
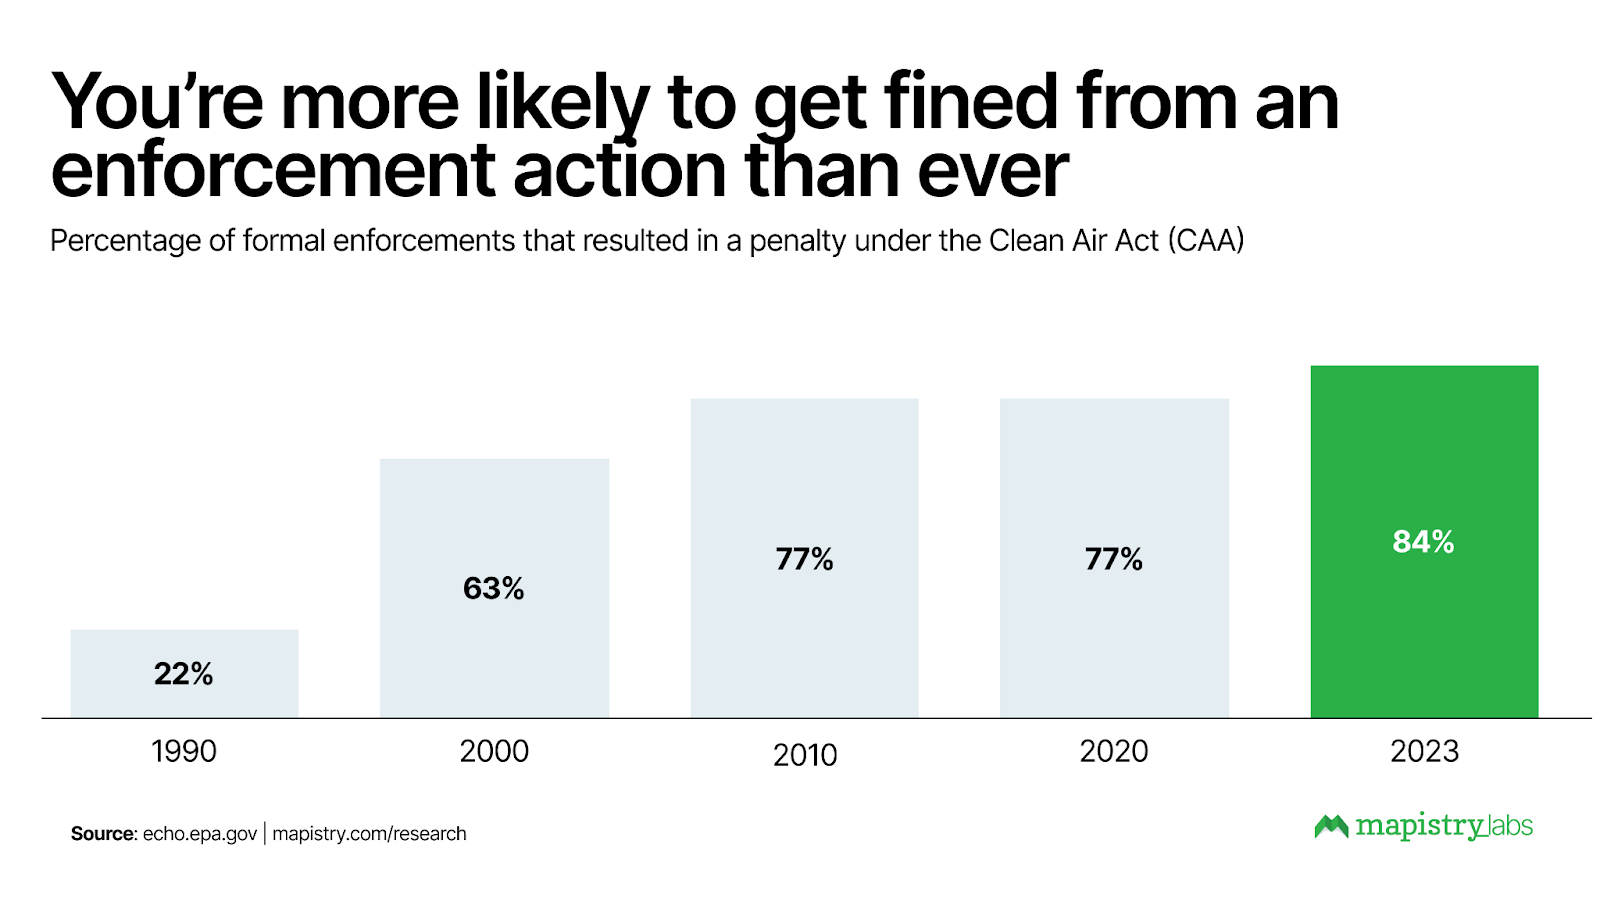
Insight #4: In 2023, 84% of formal enforcement actions resulted in a fine
Say a CAA formal enforcement is headed your way. How likely is it that you’re going to get fined? The answer: Very likely.
We calculated the percentage of formal enforcements that ended with a fine. In 1990, just 25% of formal enforcement actions resulted in a fine. By 2000, that percentage had shot to 63% and has since gradually climbed to 84% in 2023.
Executive summary: More NOVs and fewer formal actions with higher penalties
If you haven’t been paying attention or don’t have time to look at our beautiful charts, here are the key takeaway from this article:
- NOVs peaked in 2005, declined until 2020, and are on the rise again
- Formal enforcements declined from 2009 to 2018, and have been roughly stable since
- 84% of formal enforcements end with a penalty, and the average penalty skyrocketed to $188k in 2023
In summary, in approximately the past 4 years, the chances of getting hit with a penalty are increasing and the cost of being a violator has doubled.
You can download all images from this report here. Feel free to share them on LinkedIn while tagging Mapistry. Want to stay out of trouble? Mapistry makes environmental compliance easy. Take a product tour or book a demo to learn more.
Methodology
We analyzed the publicly available data from the EPA’s Integrated Compliance Information System for Air (ICIS-Air). For a detailed description of the dataset, please visit the EPA’s website.
During our analysis, we encountered an enforcement activity recorded in the state of Texas that was duplicated over 15,000 times and skewed our numbers. We addressed this issue by only counting unique activity IDs. This raises an important issue of data quality in public data. Had the record been duplicated fewer times, we may not have noticed the error and gone ahead with our (faulty) analysis. While we’re “just” doing this for educational purposes, other organizations make important decisions using these data sources, so it’s shocking to see such a glaring error in a government dataset.
We removed data up to the year 1980 because some years were missing data. We also excluded 2024 data as it is incomplete.
We analyzed data using Row Zero and visualized it with the help of Google Sheets and Figma.